The observability stack covers metrics, logs, and dashboards with minimal footprint. It
lives under K8s/observability/ and is powered by Prometheus, Loki, Fluent-bit, and
Grafana.
This page is the component view for the “Observability” part of the developer‑facing stacks.
Components at a Glance
| Component | Deploy Path | Purpose |
|---|---|---|
| Prometheus | K8s/observability/kube-prometheus-stack/ | Scrapes cluster + workload metrics, exposes Alertmanager + Grafana. |
| Fluent-bit | K8s/observability/fluent-bit/ | Tails container logs on every node and forwards to Loki. |
| Loki | K8s/observability/loki/ | Stores logs in boltDB shipper mode (single replica for k3d). |
| Pyrra | K8s/observability/pyrra/ | SLO management with Prometheus integration. |
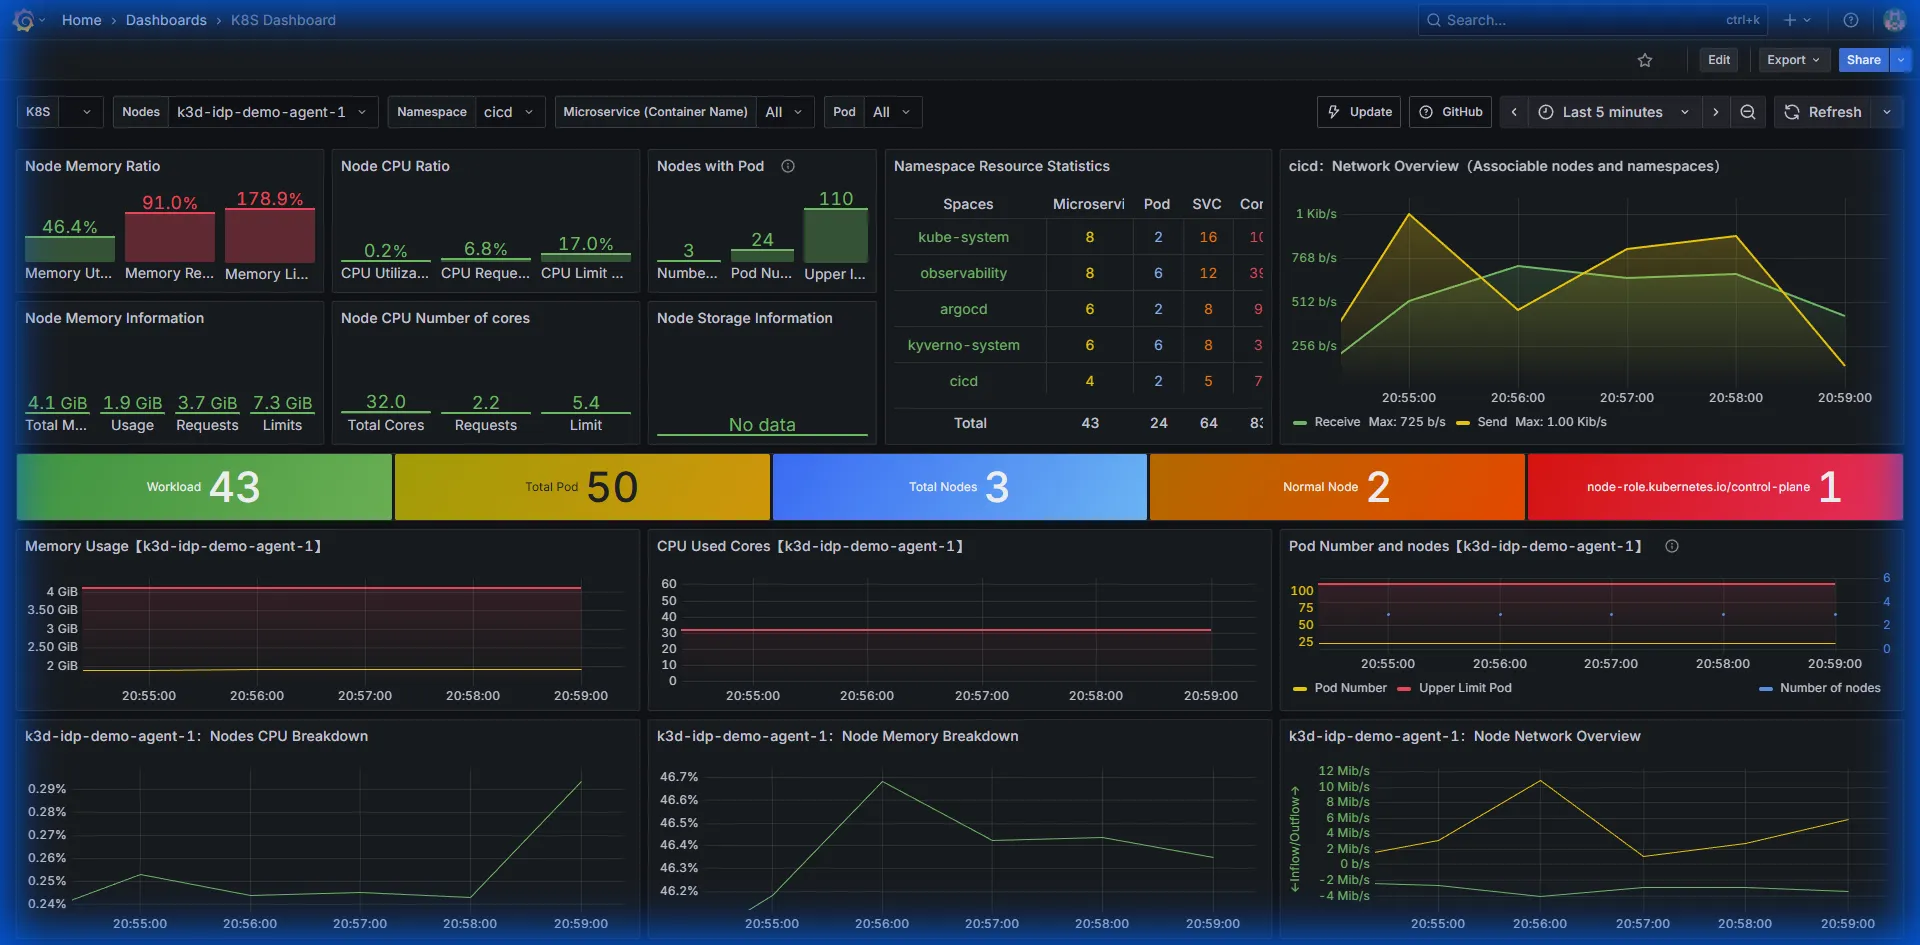
| Grafana | Bundled via Prometheus stack | Serves dashboards; integrates with Prometheus + Loki datasources. |
Repo wiring & tasks
The ApplicationSet in K8s/observability/applicationset-observability.yaml watches
K8s/observability/*. Deploy only the observability stack with
task stacks:observability. Grafana admin credentials are synced from Vault via
ExternalSecret (kube-prometheus-stack/grafana-admin-externalsecret.yaml).
Data Flow

Source: observability-dataflow.d2
Instrumentation Strategy
Each stack component (ArgoCD, Kyverno, Trivy, etc.) exposes metrics via ServiceMonitors
annotated with the prometheus: kube-prometheus label so the Prometheus Operator
scrapes them automatically. Common app.kubernetes.io/* labels ensure dashboards can
group data by stack or owner, tying into FinOps tagging. Prometheus stores approximately
2 days of data while Loki uses boltdb-shipper with 5Gi PVC to stay laptop-friendly
(adjust in kube-prometheus-stack-values.yaml and loki-values.yaml for longer
retention). Grafana sidecars import dashboards from
K8s/observability/kube-prometheus-stack/dashboards/, keeping everything
GitOps-managed.
Alerting
The Prometheus stack enables Alertmanager but does not send notifications by default. To
enable alerts, create a Secret named alertmanager-kube-prometheus-stack-alertmanager
with your receiver configuration, update alertmanager.config in
kube-prometheus-stack-values.yaml to reference the secret or inline config, and commit
to let ArgoCD roll out the change.
Verify
- Grafana UI:
https://grafana.<ip-dashed>.nip.iovia Gateway - Prometheus targets: check
Status → Targetsand confirmkubernetes-apiservers,node-exporter, etc. - Loki logs: Explore → Loki →
{namespace="observability"}to see stack logs
Custom Dashboards Workflow
Platform engineers add or update JSON files under
K8s/observability/kube-prometheus-stack/dashboards/. After committing, the
ApplicationSet syncs and the Grafana sidecar reloads dashboards automatically. Verify
changes in the Grafana UI.
Extending the Stack
- Add Tempo/OTel: Create
K8s/observability/tempo/with a Helm chart entry and reference it from the ApplicationSet. - Per-team dashboards: Use folder provisioning and
grafana.dashboardsvalues to organize by stack (observability,cicd, etc.). - Metrics federation: Enable the Prometheus
federationjob in values if sending data to an external monitoring plane.