Resource sizing strategy
This demo applies a three-layer capacity model: component-level definitions, namespace governance, and priority-based scheduling.
Layer 1: Component resources
Every component defines explicit requests and limits:
- Requests: guaranteed allocation; scheduler uses this for placement decisions
- Limits: maximum allowed; enforced by cgroups
Example from K8s/observability/fluent-bit/values.yaml:
resources: requests: cpu: 25m memory: 64Mi limits: cpu: 100m memory: 128MiSizing philosophy applied here:
The sizing strategy varies by component role. DaemonSets like Fluent-bit and Node Exporter use minimal footprints since they run on every node. Control plane components (ArgoCD, operators) receive modest allocations as they are mostly I/O-bound. Observability stack components (Prometheus, Loki) are sized for a 3-node demo running approximately 20 workloads. CI/CD components (Workflows, SonarQube) get larger allocations to handle ephemeral burst capacity.
Check any *-values.yaml to see applied sizing.
Layer 2: Namespace quotas
Each stack has a governance/resourcequota.yaml that sets hard ceilings:
spec: hard: requests.cpu: '1500m' requests.memory: '2Gi' limits.cpu: '4' limits.memory: '4Gi'Purpose: prevent noisy neighbors; enforce capacity planning.
Verification:
kubectl get resourcequota -Akubectl describe resourcequota -n observabilityYou’ll see current usage vs. hard limits. For example:
requests.cpu: 1050m/1500mlimits.memory: 3600Mi/4GiLayer 3: Priority classes
Every workload declares priorityClassName (enforced by validation script):
platform-infrastructure(1M): Cilium, cert-manager, Vault, ESOplatform-policy(100k): Kyvernoplatform-observability(10k): Prometheus, Grafana, Lokiplatform-dashboards(5k): Backstage, Grafanaplatform-cicd(7.5k): Argo Workflows, SonarQubecicd-execution(2.5k): workflow podsuser-workloads(3k): default for appsunclassified-workload(0): catch-all; preempted first
When pressure occurs, Kubernetes evicts lower-priority pods to make room for higher-priority ones.
Check with:
kubectl get priorityclasseskubectl get pods -A -o custom-columns=NAME:.metadata.name,PRIORITY:.spec.priorityClassNameTuning for your environment
- Scale up: adjust quotas in
governance/resourcequota.yamlper stack - Component sizing: tweak
resourcesin*-values.yamlbased on load testing - Priority rebalancing: if different services are critical in your context, adjust
IT/priorityclasses/*.yaml
This model keeps demo lightweight (~4GB total footprint) while showing production patterns.
Visual representation
The three-layer model and how the scheduler uses each layer:

Real cluster verification
See the model in action in the demo cluster:
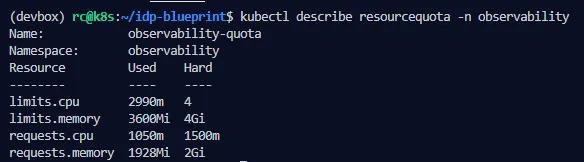 Screenshot
of
Screenshot
of kubectl describe resourcequota -n observability showing current usage vs. hard
limits
Observability knobs
- Prometheus:
retention, TSDB storage,scrapeInterval, drop high‑card labels. - Loki: pipeline stages, label hygiene, storage backends.
- Dashboards: render fast; prefer recording rules for expensive queries.
Performance and safety
- Requests/limits tuned per component; quotas/limits per namespace.
- Backpressure: Fluent‑bit buffers; Loki ingestion limits.
- Avoid high cardinality metrics (pod UID, container ID) unless really needed.
Cost & footprint
- Disable non‑critical components in dev/demo; scale up in staging/prod.
- FinOps labels are already enforced; use them to attribute and decide.