Verify Installation
Verify the deployment is converging, identify any resources still settling, and gather the URLs and credentials needed to access platform services.
First few minutes
ArgoCD keeps syncing after task deploy exits. Pods move from Pending to Ready as
images download, so Sync/Health will improve gradually rather than instantly.
Quick checks from the terminal
kubectl get nodeskubectl get pods -A | sortkubectl -n argocd get applications
# Optional: watch livekubectl get pods -A -w &kubectl -n argocd get applications -w &
# Gateway readiness (TLS and routes bound)kubectl -n kube-system wait --for=condition=Programmed gateway/idp-gateway --timeout=300s
Expected signals:
- Three Ready nodes (named
k3d-idp-demo-*) - ArgoCD Applications listed (may require minutes to reach Healthy/Synced)
- Gateway wait command succeeds (condition: Programmed)
- External Secrets objects present, ArgoCD secret exists in
argocdnamespace
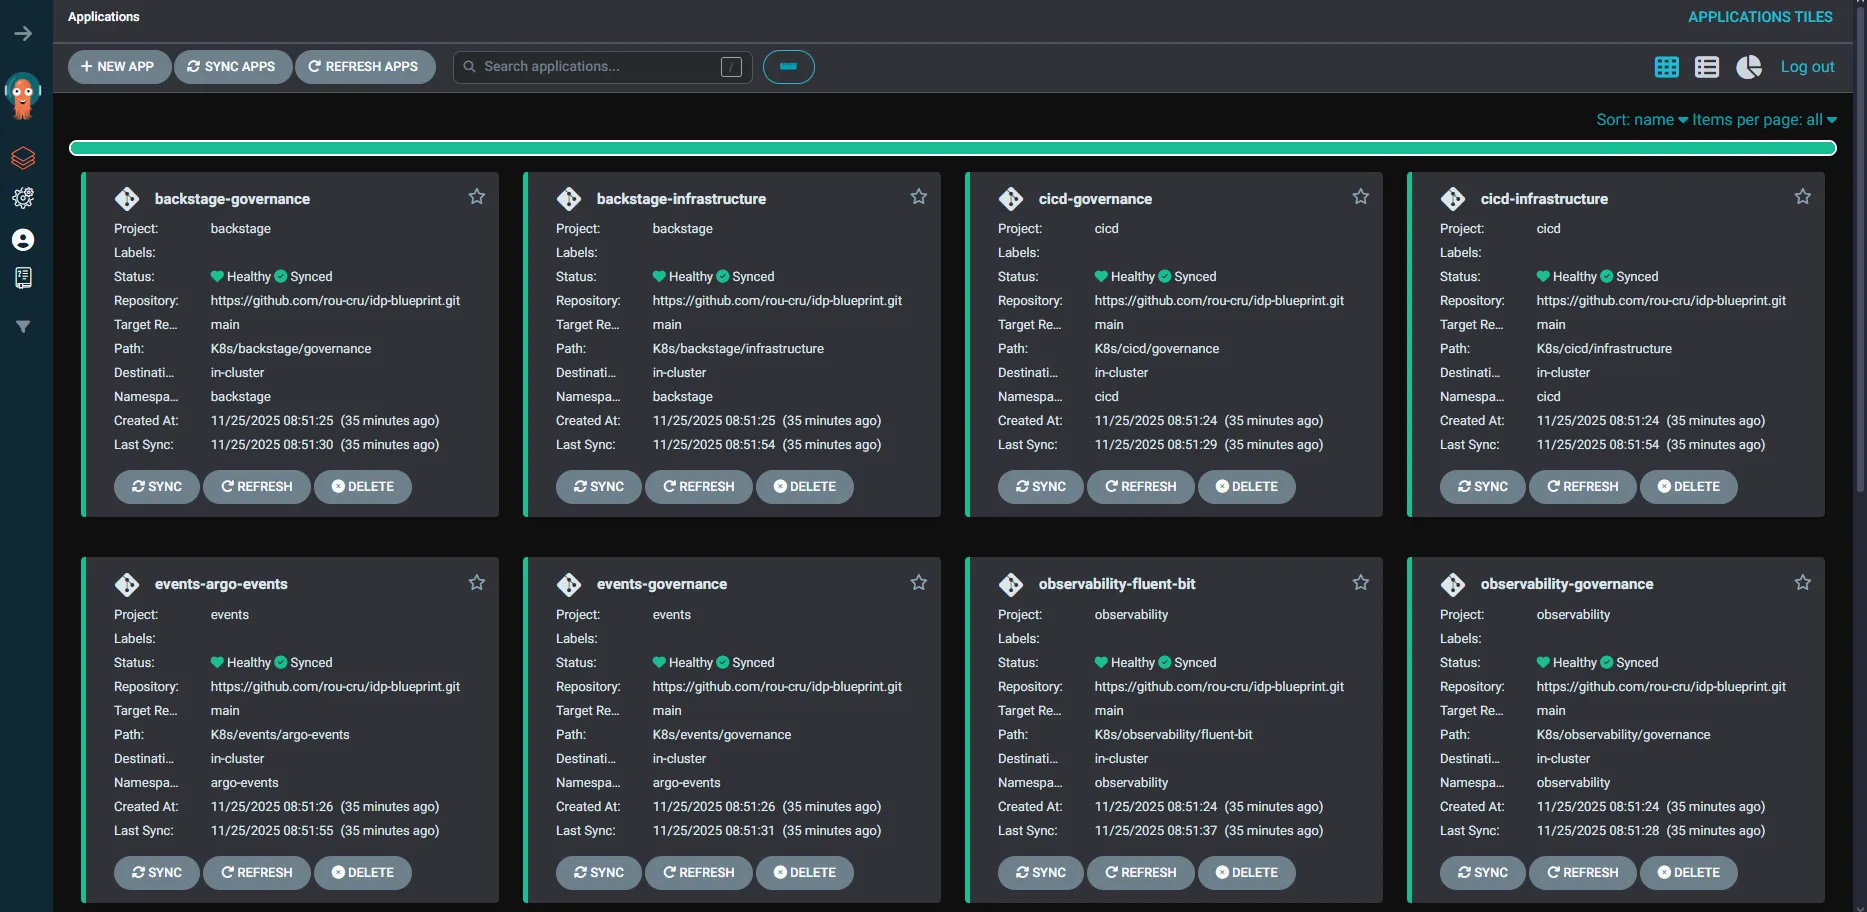
Visual walkthrough

Application cards in ArgoCD show Sync and Health status; some OutOfSync states are
normal during initial convergence. Left sidebar projects correspond to the fuses enabled
in config.toml. Opening a card reveals the resource graph and metadata.
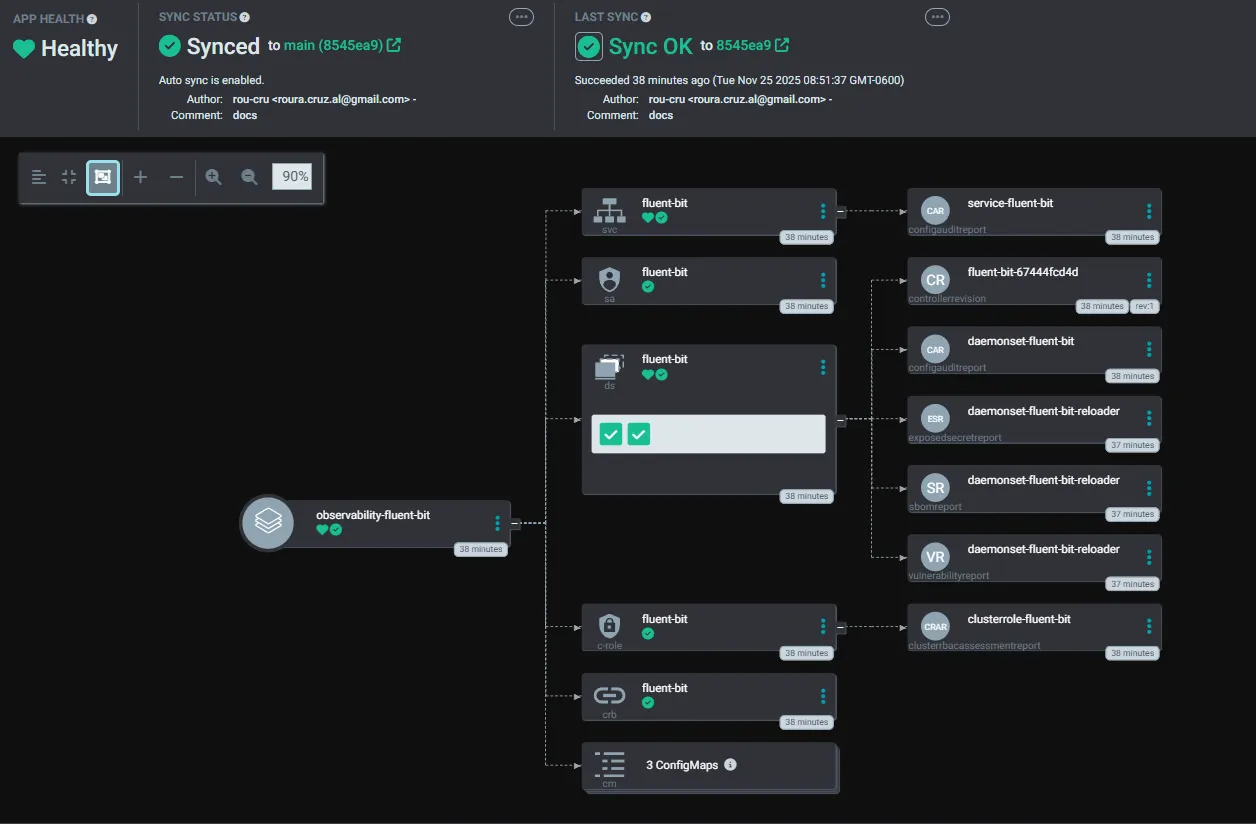
Inside an application (e.g., observability-kube-prometheus-stack) you can see the
graph plus source, destination, and manual Refresh/Sync controls.
Prefer the terminal? Use k9s -A and jump between :pods, :deploy, :events to
watch live.
Access endpoints
task deploy prints nip.io URLs based on your LAN IP:
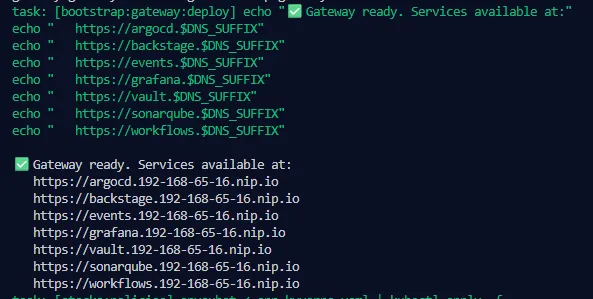
Patterns replace <ip-dashed> with your LAN IP: ArgoCD at
https://argocd.<ip-dashed>.nip.io, Grafana at https://grafana.<ip-dashed>.nip.io,
Vault at https://vault.<ip-dashed>.nip.io, Argo Workflows at
https://workflows.<ip-dashed>.nip.io, SonarQube at
https://sonarqube.<ip-dashed>.nip.io. They are reachable from other devices on your
LAN if your OS firewall allows NodePorts 30080/30443 (or the values in
config.toml).
Login notes
- ArgoCD admin:
admin - Password: value from
config.toml(passwords.argocd_admin, defaultargo), stored bcrypt in the ArgoCD secret. - CLI from LAN: ArgoCD runs HTTP behind the Gateway, so use
--plaintext:
argocd login argocd.<ip-dashed>.nip.io --username admin \ --password <value-from-config.toml> --plaintextCertificates
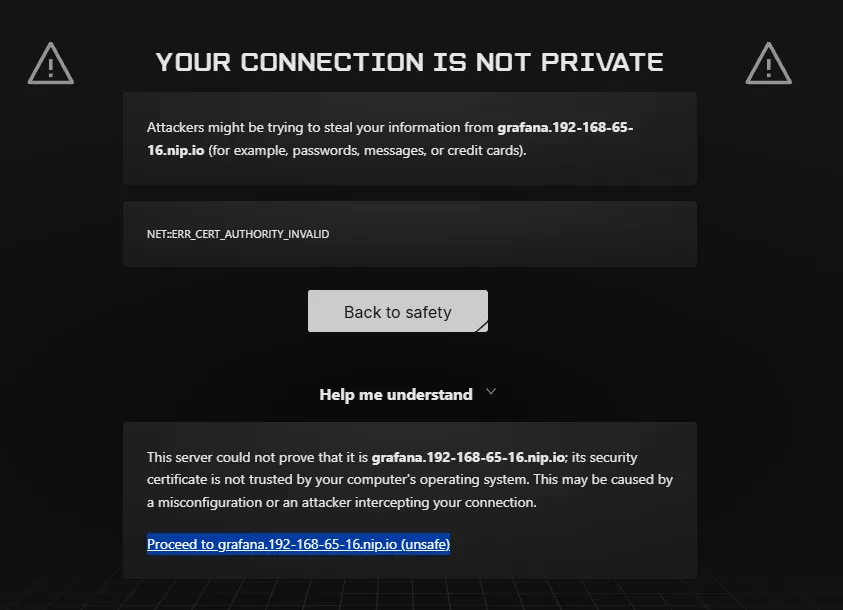
TLS uses a local, self-signed root CA for *.${DNS_SUFFIX} (derived from your LAN IP).
Browsers will warn on first visit; you can proceed or import the CA.
# Export the root CA from cert-manager (cert-manager/idp-demo-ca-secret)kubectl -n cert-manager get secret idp-demo-ca-secret \ -o jsonpath='{.data.tls\.crt}' | base64 -d > idp-demo-ca.crt- macOS: Keychain Access → System → Certificates → import
idp-demo-ca.crt→ “Always Trust”. - Linux (Debian/Ubuntu):
sudo cp idp-demo-ca.crt /usr/local/share/ca-certificates/ && sudo update-ca-certificates - Windows:
certmgr.msc, import into “Trusted Root Certification Authorities”.
Certificates are issued automatically by cert-manager using that wildcard; the CA secret
lives at cert-manager/idp-demo-ca-secret.
Smoke checks
- ArgoCD apps listed and converging:
kubectl -n argocd get applications→ apps show up and move towardSyncedwithin a few minutes. - Grafana up with datasources: open
https://grafana.<ip>.nip.io→ UI loads with Prometheus/Loki datasources present. - Trivy Operator running:
kubectl -n security get pods | rg --line-number "trivy"→trivy-operatorandtrivy-serverpods are Ready. - External Secrets working:
kubectl get externalsecrets,secretstores -A→ objects exist; ArgoCD secret present (kubectl -n argocd get secret argocd-secret). - Gateway programmed with certs:
kubectl -n kube-system get gateway idp-gateway -o yaml | rg --line-number "Programmed"→ conditionProgrammedis True and endpoints reachable over TLS.
If something stalls
- Pods in
ImagePullBackOff: check network access, free disk, then retrytask deploy. - Gateway not ready: free the ports defined in
config.tomland re-run the wait command. - Applications stuck OutOfSync: use ArgoCD UI or
argocd app sync <name>after images are present.